What
kinds of Data are stored in this database | How to browse
database | About
Interactive visualization of flux distribution | How to Search
through the database | The
algorithm details for the flux comparison | How to
compare flux distributions | How to
download flux distributions | How to submit
Data
What kinds of Data are stored in
this database
Each individual case of flux distribution includes several data fields describing the information of origin, the physiological parameter, a case-specific description and the flux distribution. The detailed data fields were displayed in the following table.
How to browse database
The CeCaFDB provides two entry points for browsing items related to a complete description of a metabolic flux map.
Browse flux distribution
This entry is directed to the hierarchy and allows the users to taxonomically browse the database. Upon clicking the button, a summary page is displayed, providing a general description of the organisms and the relevant references. Clicking an organism name will display the whole list of references related to this organism. Users can easily navigate to the flux map pages within the reference. The structure of the flux map page contains several parts. The first part is an interactive graphical representation of the flux distribution based on the Flash-based CytoscapeWeb software. A select box next to a ‘Go To’ button is located above the graph. To view the graph, you can select a favorite case of flux distribution through the select box and click the ‘Go To’ button.
The second part is a table representation of the flux distribution. Here, the ‘Reaction name’ denotes the KEGG code for a specific reaction. There are three types of ‘Reaction name’ in CeCaFDB. The first is a classical reaction code such as R01002 in KEGG, which denotes an elemental reaction in the central carbon metabolism. The second is labeled as ‘transport’ that represents all transport across biological membranes, such as malate transport or succinate transport. The third is labeled as ‘unknown’ that includes all lumped reactions connecting carbon sources to central carbon metabolites. The ‘Reaction’ displays the chemical equation that occurred in the reaction. The ‘Flux value’, the core of the database, displays the quantity of the flux value relative to the substrate uptake rate. In the case of multiple substrates, the sum of all the substrates uptake rates is set to 100.
The NADPH and ATP production capacities were recalculated based on the flux values. Where the flux values are missing for certain reactions contributing to NADPH or ATP production, the production rate is shown as N/A. The P/O ratio was set as 2.5 for NADH and 1.5 for FADH2. Since the substrate specificity of isocitrate dehydrogenase and malic enzyme might wobble betweenNADH and NADPH, a determined ATP or NADPH production rate is rarely available. Alternatively, CeCaFDB provides the maximum and minimum of NADPH and ATP production rates by assuming those enzymes operated exclusively with NADH or NADPH.
The third section of the page contains information for each flux distribution and a link to the original source of the reference. The description information contains subitems, including the ‘Strain’, ‘Culture medium’, ‘Carbon source’, ‘Growth rate’, ‘Specific rate’ and ‘Case-specific description’ (see above for descriptions of their meanings).
Browse metabolites and reactions
This entry point is directed to a page including the category information of the metabolites and reactions involved in all the flux maps. On this page, all the metabolites ‘belonging to the central carbon metabolism’ curated in the database were defined in a metabolite index list since the scope of CeCaFDB was concentrated on central carbon metabolism. Only reactions where the reactants and products belonged to the metabolite index list were included in the database. The reactions not meeting this description were excluded from our database due to the limited amount of literature. This web page contains a total of 66 kinds of metabolites and 76 kinds of chemical reactions constituting the central carbon metabolite systems for all of the collected organisms.
About Interactive visualization of flux distribution
The CeCaFDB utilizes the Cytoscape Web API to visualize representations of the metabolic flux maps. This interactive visualization tool has its roots in the popular Cytoscape Web platform, but uses Flash technology instead of Java to reduce launch time. It is compatible with any web browser. The latest version of Cytoscape Web works best with up to several thousands of nodes and edges that completely satisfies the requirements of flux map visualization. The flux map is delivered into the Cytoscape Web API using selected parameters, drawing a dynamic graphical display that enables users to move and modify the node and edge properties. Furthermore, the graph can be panned and zoomed in the same layout. In the default configuration, a metabolite is denoted by a blue circle and the reaction by a blue eclipse. A light blue edge denotes a forward flux, whereas a light red edge represents a backward reaction. The edge width is proportionate to the flux value, which is also displayed on the graph with black letter. The boundary between the compartmentation of the organelle and the intra/extracellular environment is represented by closed brown lines, and the compartmentation names are displayed. The chemical transport between different compartmentations and the substrate uptake are embodied by the layout to ensure a meaningful picture.
How to Search through the database
As with any web-enabled database, the CeCaFDB supports standard text queries. Users can combine multiple search terms in the easy search facility on the homepage, for example, ‘coli G6PDH’ will generate all of the studies that include the terms ‘coli’ and ‘G6PDH’. Furthermore, it is possible for users to further refine a search using the advanced search, which can be accessed using the SEARCH tab. In this functional module, the search facility offers access to search free text using the underlying data fields, including the experiment title, species name, genetic background, cultivation conditions and protocols, enzymes and flux values. For instance, if the ‘Enzyme’ field has ‘R00402’ (reaction number) entered and the ‘Flux value’ field has ‘45 and 50’ entered, the returned results will only contain flux distributions with enzyme R00402 and a flux value between 45 and 55. Each hit contains two segments of information. The first is the species name and the second is the reference name and the matching field, which is emphasized by red color in the search. Users can simply click on the reference title to learn more of the details.
The algorithm details for the flux comparison
Vector based comparison
An intuitive representation of the flux distribution takes the form of a vector V whose element is the value of each reaction in the concerned metabolic network. In such a way, the comparison and analysis between the flux distributions can be accessed by the angular cosine of different distribution vectors

A and B represent different vectors and n represents the dimension of the vectors.
Stoichiometry-based comparison
The vector treatment of the flux distribution comparison takes different reactions into equal consideration without losing information regarding the relative weight of the reactions. However, the reaction’s impact on the material flow of the metabolic network varies based on the diverse number of consumed reactants and different amounts of product, namely the stoichiometric constraints. Hence, a more appropriate representation of the flux distribution and a description of the flux comparison should incorporate the chemical stoichiometric constraints into the flux value. With the intention of describing the flux distribution with stoichiometric information, the flux matrix F was created by multiplying the stoichiometric matrix by the flux vector as follows:

where S stands for the stoichiometric matrix of a metabolic network. The flux matrix F incorporates the chemical stoichiometric constraints into the description of the flux value and is suitable for further comparison of the flux distribution. In the flux matrix framework, similarity between the flux distributions can therefore be defined as follows:
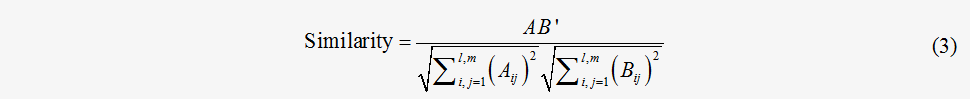
where A and B stand for the different flux matrixes. l and m are the dimensions of the matrixes. This similarity measurement has assimilated information regarding both the flux values and stoichiometric coefficients; therefore, it might be a better approximation of the similarity of the flux distribution.
Topology-based comparison
However, even the stoichiometry-based method cannot represent solid consideration of a metabolic flux comparison. The metabolic flux is flowing through a metabolic network with a specific topological structure for a particular function. Because the topology and function relationship is of great importance for all the metabolic networks, it is necessary for the comparison tool to be powerful enough to take into account both the network architecture similarities and the node similarities. To achieve this objective, a pathway alignment algorithm was modified from the one proposed by Zhengping et al. and was combined with the flux value weight to adapt to flux distribution comparisons. In short, the metabolic flux distribution comparison problem was based on a weighted directed graph alignment representation. The similarity calculation between the two metabolic flux maps was then transformed into an optimal weighted alignment between the two graphs.
A metabolic flux distribution with l metabolites and n reactions can be treated as a weighted directed graph G(N,E,W) whose nodes N correspond to the reactions and whose edges E connect with the nodes if the product of one reaction serves as the substrate of the other. Before formulating the flux comparison problem with a graphical representation, we should first parameterize the weighted adjacent matrix and node-similarity matrix.
Weighted adjacent matrix
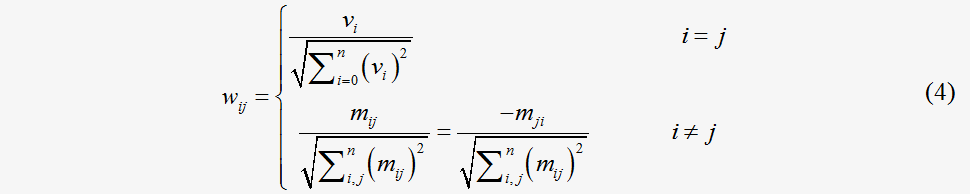
Let mij denote the summed stoichiometry coefficients of the compounds shared by the products of the i-th reaction and the reactants of the j-th reaction. The mij=d(|Skiski|+|Skjskj|).δ equals 1 when Skiski≧0 and δ equals -1 when ∑kiski < 0 . The value of mij is set to zero when no common compounds are shared by the two reactions. Let vi denote the flux value of the i-th reactions. The weight of the graph is introduced by constructing the weighted adjacent matrix W{wij}, which is elaborately designed to incorporate both the flux value and stoichiometry. The determination of the elements of W is described by Eq. (4).
Node similarity function
There have been several similarity functions proposed to produce a similarity score between a pair of reactions or enzymes, such as functions based on the similarity of amino acid sequences or information content regarding an enzyme class hierarchy. In our model, a function was based on the probability that two enzymes are the same in the enzyme hierarchy. The enzyme hierarchy is the hierarchy constructed with the EC numbering system (e.g. [3:2:2:1], [3:2:1]). For the two enzymes u and v, a common upper class is defined as the enzyme class huv, which is the lowest class in the upper classes of enzymes on the enzyme hierarchy. For the same enzymes, their common upper class is their enzyme class. For example, [2:2:3] are the common upper classes between [2:2:3:4] and [2:2:3:5]. The C(h) expresses the number of elements for all of the enzymes whose classes are included under the enzyme class h. A similarity function between eu and ev is defined as follows:

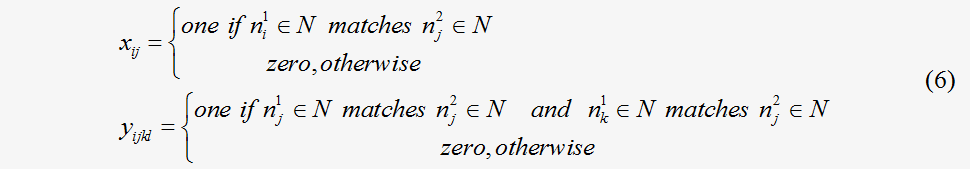
which provides a normalized similarity function that incorporates values in the interval [0, 1]. In our algorithm, given two metabolic flux maps G1=G1(N1,E1,W1) and G2=G2 (N2,E2,W2) , where N1={n11, n21,…, no1} and N2={n12, n22,…, np2} , the weighted adjacent matrixes of G1 and G2 are A=(aij)oxo and B=(bij)pxp , as constructed in Eq. (5). As suggested by Zhengping et al., the matching between nodes (ni1, nk1)∈N1 and (nj1, nl1)∈N1 and between edges(ni1, nk1)∈N1 and (nj1, nl1)∈N1 is represented by the binary variables xij and yijkl respectively, as follows:
Obviously, each X={xij} and Y={yijkl} determine the local alignment between two flux maps G1 and G2. The similarity between the two flux maps G1 and G2 according to a given alignment matrix X of nodes, is thus calculated as a sum score including both the node and edge matching scores in an objective function, as in Eq. (7), which is similar to the form of the inner product of the flux vector.
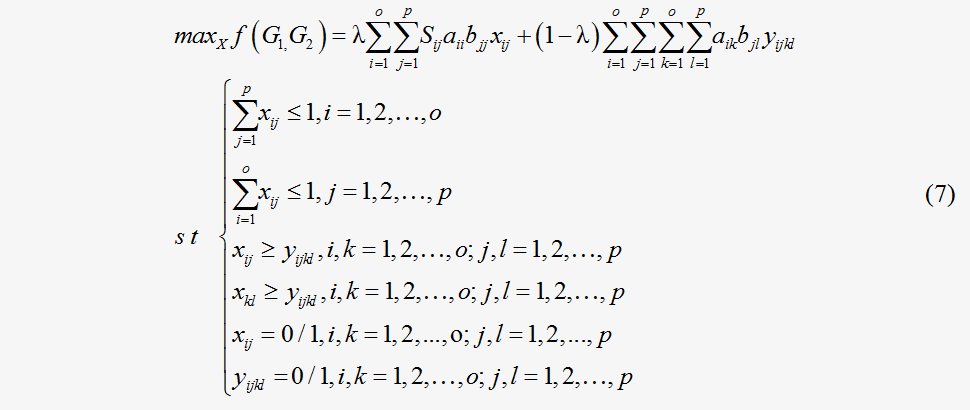
The first two constraints ensure that the relationship between two nodes is a one-to-one correspondence or involves no matches. The third constraint implies the integer constraint for the variable . In this framework
  is a scaled parameter between 0 and 1 that is aimed at reaching a
compromise between the node (flux value) and edge (stoichiometry)
score. The structure of this objective function provides a
normalized similarity function that incorporates values from the
interval [-1, 1]. A pair of identical flux maps yields a
similarity function of 1, whereas a pair of flux maps with
identical structures and reversed reactions yields a similarity
function of -1.
is a scaled parameter between 0 and 1 that is aimed at reaching a
compromise between the node (flux value) and edge (stoichiometry)
score. The structure of this objective function provides a
normalized similarity function that incorporates values from the
interval [-1, 1]. A pair of identical flux maps yields a
similarity function of 1, whereas a pair of flux maps with
identical structures and reversed reactions yields a similarity
function of -1.
How to compare flux distributions
Based upon the three algorithms mentioned above, the CeCaFDB’s Alignment Tab provides four different comparison tasks: ‘Vector-based similarity’, ‘Stoichiometrybased comparison’, ‘Enzyme Topology-based similarity’ and ‘Topology-based similarity’. For the vector- and stoichiometry-based tasks, a calculation is carried out on the shared reaction set between the two flux distributions. The ‘Enzyme topology-based similarity’ is implemented using integer programming by taking λ as 1. The ‘Topologybased similarity’ should be launched with a user-designated parameter-vertex to the edge score balance (λ value), which determines the relative impact of the vertex and edge scores on the final similarity score. This can be fine-tuned according to the user’s need. We have implemented a proposed integer-programming algorithm using the YALMIP and Gurobi softwares. The 2D X and 4D Y were transformed into 1D data and compressed into one single array to save memory requirements and to adapt to the requirement of the optimization package.
By clicking the ALIGNMENT tab, user will enter the flux comparison page. On this page, there are three select boxes for ‘species’, ‘reference’ and ‘flux distribution’. Through the use of these three boxes, the specific flux distributions to be compared can be selected by the user. After that, clicking the SELCET button will transfer the selected case to the SELECTED box. Repeating this process will add all the desired cases to the SELCETED box. The cases can be deselected by clicking the REMOVE button. Clicking the COMPARISON button will initiate a pairwise similarity analysis on the flux distributions in the SELECTED box except that the ‘Topology-based similarity’ currently receives the alignment job only between two flux distributions.
The comparison results from the latter two methods contain a similarity score, a P-value and an URL link to the graphical representation of the alignment solution. The statistical P-value was calculated with a Monte Carlo permutation test, in which the same comparison was executed against a 100-flux map with random sampled values and with the P-value obtained by counting the fraction of the flux distributions containing alignments that received higher scores. The legends in the graphical representation of the flux comparisons are similar to those in the flux visualization, except that the olive line connecting the enzymes represents the relationship match between the two flux maps, whereas the line width was proportionate to the contribution factor from each enzyme pair to the ultimate similarity score. In addition, on this graphical representation page, CeCaFDB offers a downloadable txt file with tabular forminformation about the matched reactions, conserved metabolic pathways, gaps in the network and solely inserted reactions.Relying on this alignment tab, CeCaFDB supports flux map query tasks against all the curated flux map data through similarity comparisons after the data have been submitted to CeCaFDB.
How to download flux distributions
Users may download the CeCaFDB data containing metabolic networks and flux distribution vectors. Upon clicking the Download tab, a user will open a download page. Clicking the corresponding reference name will display the links for the corresponding flux distribution that is stored in an Excel file.
How to submit Data
TThe CeCaFDB receives submissions of the flux distribution data. The submission of data requires an account within the CeCaFDB, which can be obtained through online registration. For submissions, the flux data should be formatted in a template file on the submission page, which is similar to the input template for the VANTED software. The input file should contain the chemical equations and E.C numbers (or KEGG reaction number) of the metabolic network and the flux distribution values. Particularly important are the lumped reactions of the uploaded data,which should be broken down into their original forms as in the KEGG to be consistent with other data.
For example, the reaction formula
Glucose-6-phosphate => D-Ribulose 5-phosphate + CO2
was generally adopted in some references. In our database this reaction is broken down into the following three reactions:
Glucose-6-phosphate =>D-Glucono-1,5-lactone 6-phosphate
D-Glucono-1,5-lactone 6-phosphate => 6-Phospho-D-gluconate
6-Phospho-D-gluconate => D-Ribulose 5-phosphate + CO2
The submitted data will be checked and transformed by system administrator before they appear on CeCaFDB.
Each individual case of flux distribution includes several data fields describing the information of origin, the physiological parameter, a case-specific description and the flux distribution. The detailed data fields were displayed in the following table.
| Glossary | ||
| Field | Description | Source |
| Experiment Name | The citation information of the reference | Reference |
| Strain | The specific strain name of the organism if it was mentioned in the reference | Reference
or Manual Search |
| Culture medium | The name and the chemical composition for growth medium | Reference or Manual Search |
| Carbon source | the carbon source in the medium | Reference |
| Growth rate | The average growth rate measured which is a critical parameter determining the flux distribution | Reference |
| Case-specific description | The information necessary for differentiating the cases in a single experiment | Reference or Manual Search |
| Reaction name | The standard code in KEGG or the enzyme classification number for a reaction | 1KEGG 2BRENDA |
| Reactant | Substrates containing carbon skeleton in the corresponding reactions | 1KEGG 2BRENDA |
| Product | Products containing carbon skeleton in the corresponding reactions | 1KEGG 2BRENDA |
| Flux value | The quantity of the flux value relative to the substrate uptake rate. In the case of multiple substrates, the sum of all substrate uptake rates was set to be 100. To calculate the ATP production rat, the P/O ratio assumption is set as 2.5 for NADH as well as 1.5 for FADH2.The substrate specificity of isocitrate dehydrogenase and malic enzyme might wobble between NADH and NADPH. Therefore, a determined ATP or NADPH production rate is hardly available. Alternatively, we provide the maximum and minimum of both rates by assuming these enzymes operated exclusively with NADH or NADPH. | Reference |
| Reference | The name of the reference and its related citation information | Reference |
| Specific Rate | Substrate uptake and metabolite secretion rates relative to biomass yield(in the unit of mmol g-1h-1) available in the references. | Reference |
The CeCaFDB provides two entry points for browsing items related to a complete description of a metabolic flux map.
Browse flux distribution
This entry is directed to the hierarchy and allows the users to taxonomically browse the database. Upon clicking the button, a summary page is displayed, providing a general description of the organisms and the relevant references. Clicking an organism name will display the whole list of references related to this organism. Users can easily navigate to the flux map pages within the reference. The structure of the flux map page contains several parts. The first part is an interactive graphical representation of the flux distribution based on the Flash-based CytoscapeWeb software. A select box next to a ‘Go To’ button is located above the graph. To view the graph, you can select a favorite case of flux distribution through the select box and click the ‘Go To’ button.
The second part is a table representation of the flux distribution. Here, the ‘Reaction name’ denotes the KEGG code for a specific reaction. There are three types of ‘Reaction name’ in CeCaFDB. The first is a classical reaction code such as R01002 in KEGG, which denotes an elemental reaction in the central carbon metabolism. The second is labeled as ‘transport’ that represents all transport across biological membranes, such as malate transport or succinate transport. The third is labeled as ‘unknown’ that includes all lumped reactions connecting carbon sources to central carbon metabolites. The ‘Reaction’ displays the chemical equation that occurred in the reaction. The ‘Flux value’, the core of the database, displays the quantity of the flux value relative to the substrate uptake rate. In the case of multiple substrates, the sum of all the substrates uptake rates is set to 100.
The NADPH and ATP production capacities were recalculated based on the flux values. Where the flux values are missing for certain reactions contributing to NADPH or ATP production, the production rate is shown as N/A. The P/O ratio was set as 2.5 for NADH and 1.5 for FADH2. Since the substrate specificity of isocitrate dehydrogenase and malic enzyme might wobble betweenNADH and NADPH, a determined ATP or NADPH production rate is rarely available. Alternatively, CeCaFDB provides the maximum and minimum of NADPH and ATP production rates by assuming those enzymes operated exclusively with NADH or NADPH.
The third section of the page contains information for each flux distribution and a link to the original source of the reference. The description information contains subitems, including the ‘Strain’, ‘Culture medium’, ‘Carbon source’, ‘Growth rate’, ‘Specific rate’ and ‘Case-specific description’ (see above for descriptions of their meanings).
Browse metabolites and reactions
This entry point is directed to a page including the category information of the metabolites and reactions involved in all the flux maps. On this page, all the metabolites ‘belonging to the central carbon metabolism’ curated in the database were defined in a metabolite index list since the scope of CeCaFDB was concentrated on central carbon metabolism. Only reactions where the reactants and products belonged to the metabolite index list were included in the database. The reactions not meeting this description were excluded from our database due to the limited amount of literature. This web page contains a total of 66 kinds of metabolites and 76 kinds of chemical reactions constituting the central carbon metabolite systems for all of the collected organisms.
About Interactive visualization of flux distribution
The CeCaFDB utilizes the Cytoscape Web API to visualize representations of the metabolic flux maps. This interactive visualization tool has its roots in the popular Cytoscape Web platform, but uses Flash technology instead of Java to reduce launch time. It is compatible with any web browser. The latest version of Cytoscape Web works best with up to several thousands of nodes and edges that completely satisfies the requirements of flux map visualization. The flux map is delivered into the Cytoscape Web API using selected parameters, drawing a dynamic graphical display that enables users to move and modify the node and edge properties. Furthermore, the graph can be panned and zoomed in the same layout. In the default configuration, a metabolite is denoted by a blue circle and the reaction by a blue eclipse. A light blue edge denotes a forward flux, whereas a light red edge represents a backward reaction. The edge width is proportionate to the flux value, which is also displayed on the graph with black letter. The boundary between the compartmentation of the organelle and the intra/extracellular environment is represented by closed brown lines, and the compartmentation names are displayed. The chemical transport between different compartmentations and the substrate uptake are embodied by the layout to ensure a meaningful picture.
How to Search through the database
As with any web-enabled database, the CeCaFDB supports standard text queries. Users can combine multiple search terms in the easy search facility on the homepage, for example, ‘coli G6PDH’ will generate all of the studies that include the terms ‘coli’ and ‘G6PDH’. Furthermore, it is possible for users to further refine a search using the advanced search, which can be accessed using the SEARCH tab. In this functional module, the search facility offers access to search free text using the underlying data fields, including the experiment title, species name, genetic background, cultivation conditions and protocols, enzymes and flux values. For instance, if the ‘Enzyme’ field has ‘R00402’ (reaction number) entered and the ‘Flux value’ field has ‘45 and 50’ entered, the returned results will only contain flux distributions with enzyme R00402 and a flux value between 45 and 55. Each hit contains two segments of information. The first is the species name and the second is the reference name and the matching field, which is emphasized by red color in the search. Users can simply click on the reference title to learn more of the details.
The algorithm details for the flux comparison
Vector based comparison
An intuitive representation of the flux distribution takes the form of a vector V whose element is the value of each reaction in the concerned metabolic network. In such a way, the comparison and analysis between the flux distributions can be accessed by the angular cosine of different distribution vectors
A and B represent different vectors and n represents the dimension of the vectors.
Stoichiometry-based comparison
The vector treatment of the flux distribution comparison takes different reactions into equal consideration without losing information regarding the relative weight of the reactions. However, the reaction’s impact on the material flow of the metabolic network varies based on the diverse number of consumed reactants and different amounts of product, namely the stoichiometric constraints. Hence, a more appropriate representation of the flux distribution and a description of the flux comparison should incorporate the chemical stoichiometric constraints into the flux value. With the intention of describing the flux distribution with stoichiometric information, the flux matrix F was created by multiplying the stoichiometric matrix by the flux vector as follows:
where S stands for the stoichiometric matrix of a metabolic network. The flux matrix F incorporates the chemical stoichiometric constraints into the description of the flux value and is suitable for further comparison of the flux distribution. In the flux matrix framework, similarity between the flux distributions can therefore be defined as follows:
where A and B stand for the different flux matrixes. l and m are the dimensions of the matrixes. This similarity measurement has assimilated information regarding both the flux values and stoichiometric coefficients; therefore, it might be a better approximation of the similarity of the flux distribution.
Topology-based comparison
However, even the stoichiometry-based method cannot represent solid consideration of a metabolic flux comparison. The metabolic flux is flowing through a metabolic network with a specific topological structure for a particular function. Because the topology and function relationship is of great importance for all the metabolic networks, it is necessary for the comparison tool to be powerful enough to take into account both the network architecture similarities and the node similarities. To achieve this objective, a pathway alignment algorithm was modified from the one proposed by Zhengping et al. and was combined with the flux value weight to adapt to flux distribution comparisons. In short, the metabolic flux distribution comparison problem was based on a weighted directed graph alignment representation. The similarity calculation between the two metabolic flux maps was then transformed into an optimal weighted alignment between the two graphs.
A metabolic flux distribution with l metabolites and n reactions can be treated as a weighted directed graph G(N,E,W) whose nodes N correspond to the reactions and whose edges E connect with the nodes if the product of one reaction serves as the substrate of the other. Before formulating the flux comparison problem with a graphical representation, we should first parameterize the weighted adjacent matrix and node-similarity matrix.
Weighted adjacent matrix
Let mij denote the summed stoichiometry coefficients of the compounds shared by the products of the i-th reaction and the reactants of the j-th reaction. The mij=d(|Skiski|+|Skjskj|).δ equals 1 when Skiski≧0 and δ equals -1 when ∑kiski < 0 . The value of mij is set to zero when no common compounds are shared by the two reactions. Let vi denote the flux value of the i-th reactions. The weight of the graph is introduced by constructing the weighted adjacent matrix W{wij}, which is elaborately designed to incorporate both the flux value and stoichiometry. The determination of the elements of W is described by Eq. (4).
Node similarity function
There have been several similarity functions proposed to produce a similarity score between a pair of reactions or enzymes, such as functions based on the similarity of amino acid sequences or information content regarding an enzyme class hierarchy. In our model, a function was based on the probability that two enzymes are the same in the enzyme hierarchy. The enzyme hierarchy is the hierarchy constructed with the EC numbering system (e.g. [3:2:2:1], [3:2:1]). For the two enzymes u and v, a common upper class is defined as the enzyme class huv, which is the lowest class in the upper classes of enzymes on the enzyme hierarchy. For the same enzymes, their common upper class is their enzyme class. For example, [2:2:3] are the common upper classes between [2:2:3:4] and [2:2:3:5]. The C(h) expresses the number of elements for all of the enzymes whose classes are included under the enzyme class h. A similarity function between eu and ev is defined as follows:
which provides a normalized similarity function that incorporates values in the interval [0, 1]. In our algorithm, given two metabolic flux maps G1=G1(N1,E1,W1) and G2=G2 (N2,E2,W2) , where N1={n11, n21,…, no1} and N2={n12, n22,…, np2} , the weighted adjacent matrixes of G1 and G2 are A=(aij)oxo and B=(bij)pxp , as constructed in Eq. (5). As suggested by Zhengping et al., the matching between nodes (ni1, nk1)∈N1 and (nj1, nl1)∈N1 and between edges(ni1, nk1)∈N1 and (nj1, nl1)∈N1 is represented by the binary variables xij and yijkl respectively, as follows:
Obviously, each X={xij} and Y={yijkl} determine the local alignment between two flux maps G1 and G2. The similarity between the two flux maps G1 and G2 according to a given alignment matrix X of nodes, is thus calculated as a sum score including both the node and edge matching scores in an objective function, as in Eq. (7), which is similar to the form of the inner product of the flux vector.
The first two constraints ensure that the relationship between two nodes is a one-to-one correspondence or involves no matches. The third constraint implies the integer constraint for the variable
How to compare flux distributions
Based upon the three algorithms mentioned above, the CeCaFDB’s Alignment Tab provides four different comparison tasks: ‘Vector-based similarity’, ‘Stoichiometrybased comparison’, ‘Enzyme Topology-based similarity’ and ‘Topology-based similarity’. For the vector- and stoichiometry-based tasks, a calculation is carried out on the shared reaction set between the two flux distributions. The ‘Enzyme topology-based similarity’ is implemented using integer programming by taking λ as 1. The ‘Topologybased similarity’ should be launched with a user-designated parameter-vertex to the edge score balance (λ value), which determines the relative impact of the vertex and edge scores on the final similarity score. This can be fine-tuned according to the user’s need. We have implemented a proposed integer-programming algorithm using the YALMIP and Gurobi softwares. The 2D X and 4D Y were transformed into 1D data and compressed into one single array to save memory requirements and to adapt to the requirement of the optimization package.
By clicking the ALIGNMENT tab, user will enter the flux comparison page. On this page, there are three select boxes for ‘species’, ‘reference’ and ‘flux distribution’. Through the use of these three boxes, the specific flux distributions to be compared can be selected by the user. After that, clicking the SELCET button will transfer the selected case to the SELECTED box. Repeating this process will add all the desired cases to the SELCETED box. The cases can be deselected by clicking the REMOVE button. Clicking the COMPARISON button will initiate a pairwise similarity analysis on the flux distributions in the SELECTED box except that the ‘Topology-based similarity’ currently receives the alignment job only between two flux distributions.
The comparison results from the latter two methods contain a similarity score, a P-value and an URL link to the graphical representation of the alignment solution. The statistical P-value was calculated with a Monte Carlo permutation test, in which the same comparison was executed against a 100-flux map with random sampled values and with the P-value obtained by counting the fraction of the flux distributions containing alignments that received higher scores. The legends in the graphical representation of the flux comparisons are similar to those in the flux visualization, except that the olive line connecting the enzymes represents the relationship match between the two flux maps, whereas the line width was proportionate to the contribution factor from each enzyme pair to the ultimate similarity score. In addition, on this graphical representation page, CeCaFDB offers a downloadable txt file with tabular forminformation about the matched reactions, conserved metabolic pathways, gaps in the network and solely inserted reactions.Relying on this alignment tab, CeCaFDB supports flux map query tasks against all the curated flux map data through similarity comparisons after the data have been submitted to CeCaFDB.
How to download flux distributions
Users may download the CeCaFDB data containing metabolic networks and flux distribution vectors. Upon clicking the Download tab, a user will open a download page. Clicking the corresponding reference name will display the links for the corresponding flux distribution that is stored in an Excel file.
How to submit Data
TThe CeCaFDB receives submissions of the flux distribution data. The submission of data requires an account within the CeCaFDB, which can be obtained through online registration. For submissions, the flux data should be formatted in a template file on the submission page, which is similar to the input template for the VANTED software. The input file should contain the chemical equations and E.C numbers (or KEGG reaction number) of the metabolic network and the flux distribution values. Particularly important are the lumped reactions of the uploaded data,which should be broken down into their original forms as in the KEGG to be consistent with other data.
For example, the reaction formula
Glucose-6-phosphate => D-Ribulose 5-phosphate + CO2
was generally adopted in some references. In our database this reaction is broken down into the following three reactions:
Glucose-6-phosphate =>D-Glucono-1,5-lactone 6-phosphate
D-Glucono-1,5-lactone 6-phosphate => 6-Phospho-D-gluconate
6-Phospho-D-gluconate => D-Ribulose 5-phosphate + CO2
The submitted data will be checked and transformed by system administrator before they appear on CeCaFDB.